Water benchmarks + intelligence
Trillions depend on water.
Meet the first daily water benchmark.
Data centers, utilities, power, farms, and water-rights owners share one supply. CMDT publishes its daily benchmark price.
BACKCAST AVAILABLE
Trading on CMDT benchmarks planned for Q4 2026.
Daily Colorado backcast, 2022 to 2026. Early access to Trident and the free Water Intelligence Map.
CMDT Upper Colorado Basin Benchmark
$5,141
● ILLUSTRATIVE
FREE BACKCAST · 2022 TO 2026 · DAILY
Illustrative. Drought repriced water 2x or more. Wet years cut it ~40%. Upper Colorado backcast, 2022 to 2026.
▶ Watch the replay
Different asset classes. One underlying resource.
$18T+
Annual futures notional across agriculture, energy, and power.
Water sits behind the production in every one.
Source: CMDT estimate based on CME filing analysis.
$4.5T
U.S. municipal bonds outstanding.
The utilities and communities behind municipal credit run on water.
Source: SIFMA, Q1 2026 outstanding debt.
Nearly $3T
Projected AI infrastructure investment through 2028.
$800B+ from private credit. Every data center is a water and power decision.
Source: Apollo, citing Morgan Stanley research.
ONE REGIONAL WATER SYSTEM · FIVE BALANCE SHEETS
WHAT HAPPENS WHEN SUPPLY TIGHTENS
SNOWPACKRESERVOIR STORAGESTREAMFLOWDROUGHT
Regional water supply
Upper Colorado · $5,141/AF
WET · SURPLUS
TODAY: DROUGHT REGIME
DRY · SCARCITY
BUYS WATERData centerCooling and operationsCosts ↑ · Expansion at risk
BUYS WATERPower generatorThermal coolingCosts ↑ · Output constrained
BUYS WATERMunicipalityUtility service, bond repaymentRates ↑ · Credit stress
BUYS WATERAgricultural operationIrrigationInput cost ↑ · Fallowing
OWNS WATERWater-rights ownerHolds the asset, leases the waterAsset value ↑ · Lease income ↑
Four pay for it. One owns it. Now they share a daily reference price.
CMDT benchmarks
Oil has WTI and Brent.
Natural gas has Henry Hub.
Water needs regional reference prices.
Water trades locally. Rights, leases, one-off deals, scattered records.
CMDT normalizes that evidence into one daily basin-level reference price.
Real transactions anchor it. Physical supply conditions move it daily.
Backcast: the same methodology applied to history. Four years of daily prices before the first contract lists.
THE PRICE STACK
OilWTI and Brent✓
Natural gasHenry Hub✓
PowerERCOT and PJM✓
LandComparable sales✓
WaterNo daily benchmark→CMDT Upper ColoradoLIVE
TRANSACTION EVIDENCE
Real sales. Irregular dates. They anchor the level.
+
SUPPLY CONDITIONS
Snowpack, storage, streamflow, drought. Measured daily.
=
DAILY REGIONAL BENCHMARK
One price a day. Transactions anchor it. Supply moves it.
UPPER COLORADO · AVAILABLE
ARIZONA · TEXAS · CALIFORNIA · IN DEVELOPMENT
What a water market enables
Cost protection. Revenue protection. Two-sided trading.
WET YEAR · PRICE FALLSREGIONAL WATER PRICEDROUGHT · PRICE RISES
↓ Rights owners lose lease revenue. Short water protects it.
Water users pay more. Long water offsets it. ↑
LONG-WATER HEDGE↑
Water users
Hedge the input. Keep building.
Data centers, fabs, generators, irrigators. Long water offsets a rising regional price.
SHORT-WATER HEDGE↓
Water-rights owners
Own the right. Protect the income.
Rights owners, ag districts, municipalities, water funds. Short water protects lease revenue without selling the right.
CROSS-ASSET ANALYSIS⇄
Investors, lenders, and insurers
Connect the resource to the exposure.
Data-center equities, municipal bonds, project debt, drought-linked liabilities. Build the regional hedge each portfolio needs.
LONG / SHORT / SPREADS↕
Macro and relative-value traders
Trade scarcity in both directions.
Long tightening supply. Short easing scarcity. Spread one basin against the next as new markets list.
35%of institutions surveyed already hold water rights or leases.
One in three owns the resource. Two in three depend on it with no daily reference price.
54 of 156 respondents. Self-reported. CMDT institutional survey.
COMBINED AUM OF THE 35%
$340B+
AUM
CMDT Water Intelligence Map · Free at launch
See the constraint before you commit the capital.
Water and power. Supply and demand. County by county.


See what is being built, what it depends on, and who controls the water.
Legend
Water rights, sized by volume (AF)
Principal aquifers, USGS 2003, colored by aquifer
Rivers, USGS NHD
Legend
Water rights, sized by volume (AF)
State groundwater basins
CA Bulletin 118
TX major
TX minor
CO alluvial
CO bedrock
Rivers, USGS NHD
Legend
Power plants
Solar
Cooling water
County generation
Legend
Data centers, built or under construction
County building permits
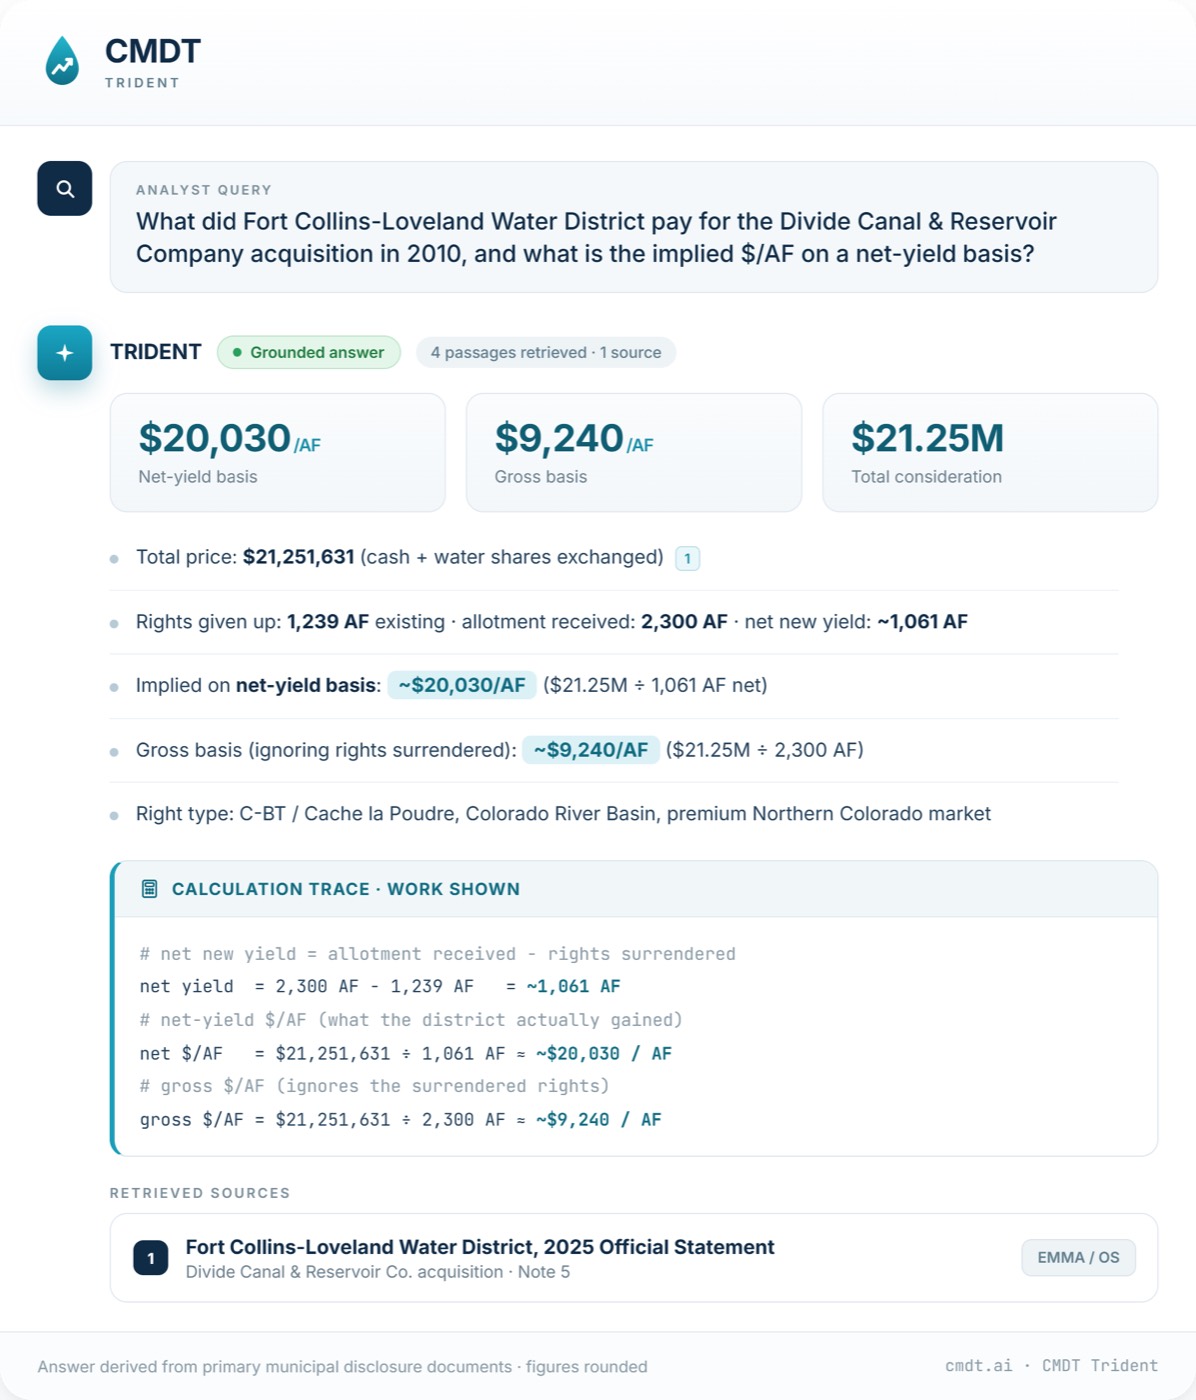
CMDT Trident
IN DEVELOPMENT · EARLY ACCESS PLANNED Q1 2027
Ask the water market a question.
Water-specific AI. A proprietary dataset. Answers you can trace.
One proprietary dataset. Transaction records, ownership documents, legal records, financial disclosures, hydrology.
Normalized across regions. Terminology, units, relationships. The distinctions that decide what a right means stay intact.
CMDT’s own AI on top. Who controls the rights around a project. What a district paid per acre-foot, and on what basis.
Every answer traces back to the source documents and the calculation.
TRANSACTIONSOWNERSHIPLEGALDISCLOSURESHYDROLOGY
ONE DATASET
normalized
→
TRIDENT
CMDT's own AI
PRODUCT PREVIEWA QUESTION → A CALCULATION → THE SOURCE RECORDS
Build your water strategy before CMDT-powered futures launch.
Four years of daily Colorado benchmark backcast. Free for research and evaluation.
Study the regimes. Test the relationships across assets.
Early access to CMDT Trident and the free Water Intelligence Map.
COLORADO BENCHMARK BACKCAST
HistoryFour years · 2022 to 2026
FrequencyDaily
AccessFree research and evaluation